Put Toyota To The Test
New on-line calculator maps the benefits of Toyota Optimal Drive
Lies, damn lies and statistics: everyone knows that you should take figures with a pinch of salt, particularly when it comes to playing up the virtues of product A compared to product B. So, when it comes to demonstrating the hard facts about the gains in ownership costs that are being delivered by Toyota Optimal Drive, you shouldn’t just take the company’s word for it; instead, Toyota has recruited an independent third party to do the number-crunching for a new on-line consumer guide.
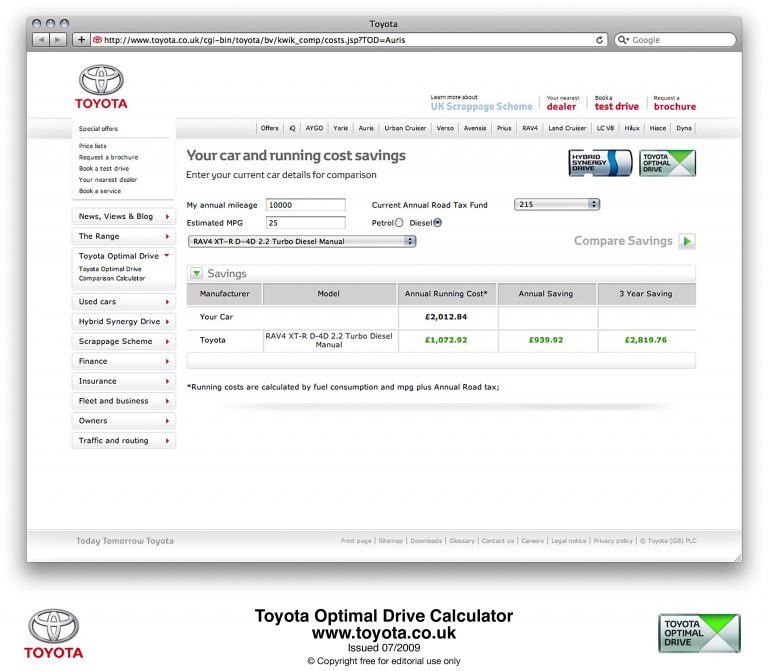
The Toyota Optimal Drive Calculator is a new addition to Toyota’s customer web site, giving motorists the chance to make quick and direct comparisons between rival models or their own vehicle. All the data, updated monthly, are sourced from KeeResources’ KWIKCarcost.
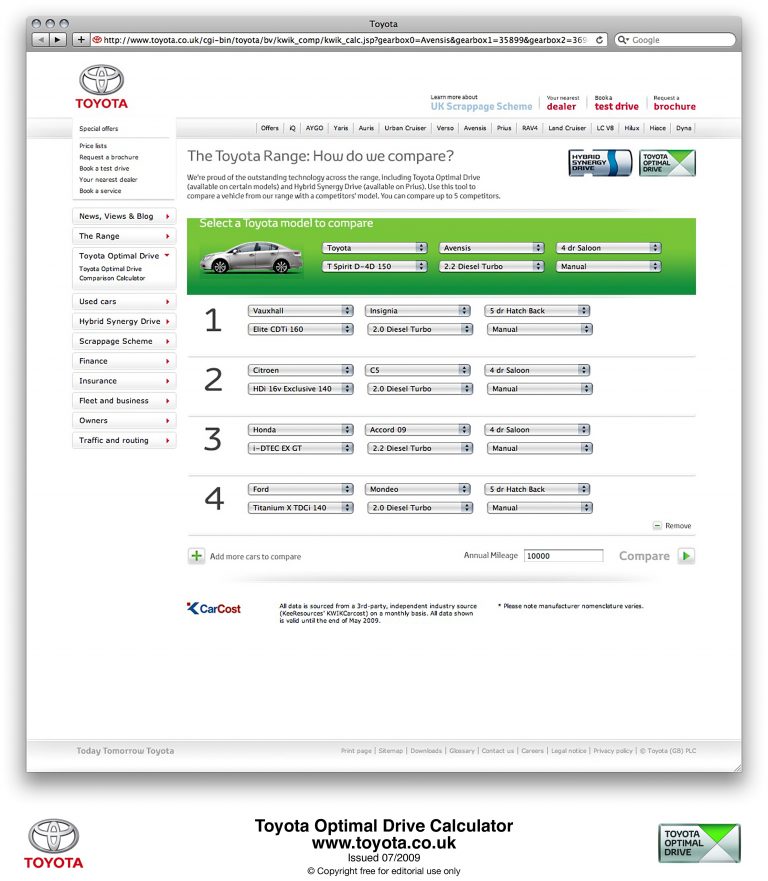
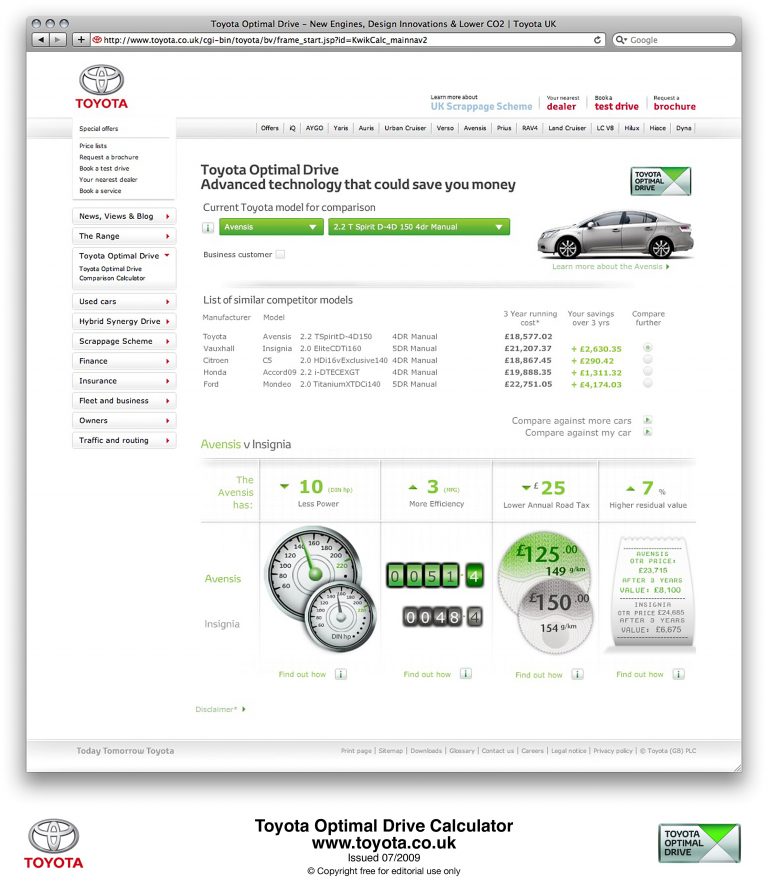
First step in using the calculator is to click on Take the Challenge on the home page, then select a current Toyota model from the drop-down menu. This triggers an instant comparison with a number of direct competitor models (again independently selected by KWIKcarcost), showing their cumulative three-year running costs and the kind of extra expense or savings owners might expect.
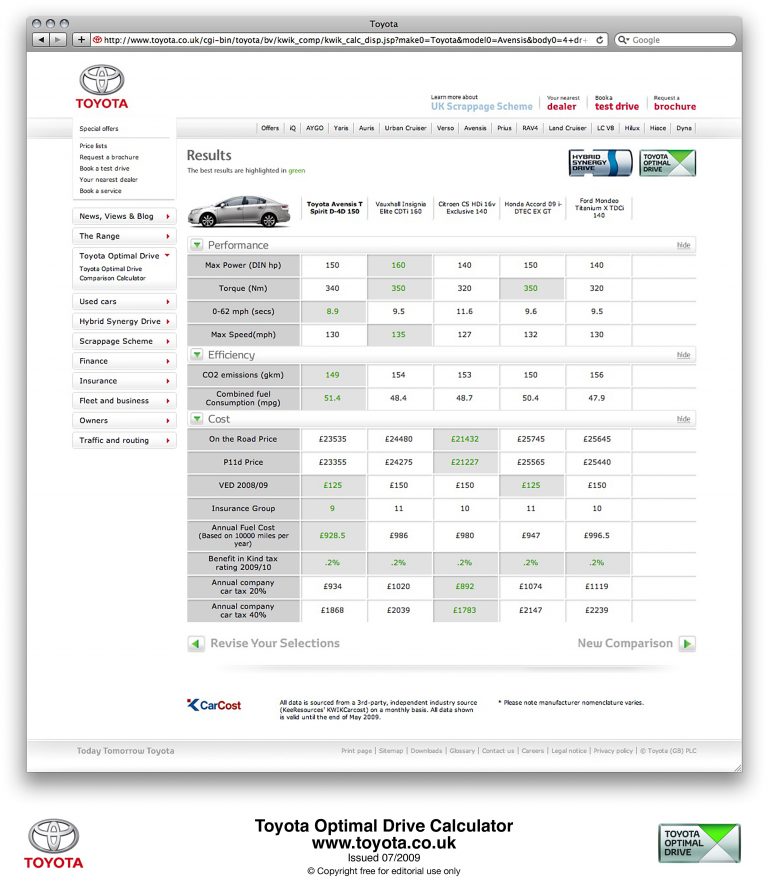
Click for “further comparisons” and the calculator will show with clear graphics and figures the respective power, mpg efficiency, road tax/CO2 emissions and residual values. Users can also extend the comparisons to many more models of their choice, clicking on the “compare with more” icon.
The calculator demonstrates the strong performance of the latest generation of Toyota models, including new iQ, Aygo, Avensis, Auris and Yaris, against their main market rivals. True to the unbiased nature of the data, however, it isn’t always the case that the Toyota performs best in any given category.
To try the Toyota Optimal Drive Calculator for yourself, visit www.toyota.co.uk.
ENDS


